New, improved Ring of Fire video
New, improved Ring of Fire video
Just finished the updated Ring of Fire video with way more info about what it shows. Lindsey helped me pick out some nice tones for the different sorts of hazards.
Tomography of subduction around the Ring of Fire
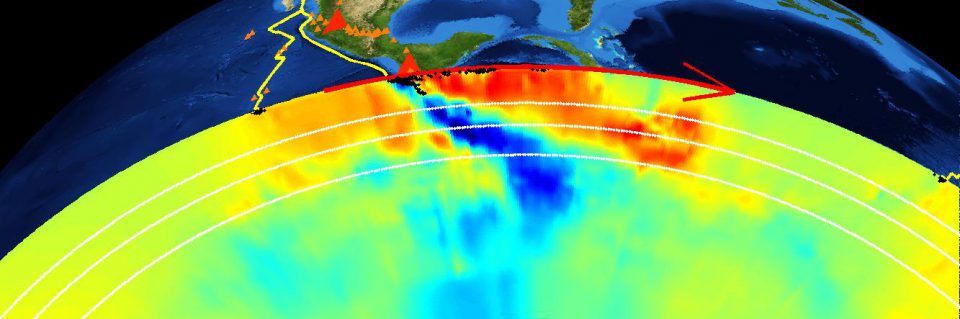
Seismic traveltime tomography gives us images of the subducted slabs of oceanic lithosphere beneath the Ring of Fire. The slices are from the P-wave model MITP_USA_2016MAY. The color scale gives the difference from a 1D model of seismic velocity, from red (1% slower than average) to blue (1% faster than average). Subducted slabs show up as fast features dipping downward from convergent margins. I think looking at it this way helps show the relationship between subduction and seismicity (black dots) and volcanism (orange triangles).
I’m cooking up a nicer version of this for the Earthscope Visualization Challenge (http://www.earthscope.org/public/visualization_challenge). There’s an iPad at stake!
Slicing North America
A nice peek at the mantle beneath North America from the latest MITP_USA model. Sections run South to North and West to East.
Exploring posterior probability
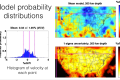
Here’s a quick animation exploring the posterior probability density function of my mantle velocity model from Burdick & Lekic (2017). The transdimensional Bayesian method gives us a giant ensemble of models that explain the data, so at any given location, we can plot up all of the potential values we find there. A couple of fun things to note:
- In complex regions where we find are sharp gradients in velocity, the distribution will often have multiple peaks, since the the boundaries of the model are allowed to move around.
- In places without data (like beneath the ocean) the algorithm traces out the uniform prior that we assume at the beginning.
- This should make it clear that the mean and standard deviation don’t always tell the whole story!
