Here’s a quick animation exploring the posterior probability density function of my mantle velocity model from Burdick & Lekic (2017). The transdimensional Bayesian method gives us a giant ensemble of models that explain the data, so at any given location, we can plot up all of the potential values we find there. A couple of fun things to note:
- In complex regions where we find are sharp gradients in velocity, the distribution will often have multiple peaks, since the the boundaries of the model are allowed to move around.
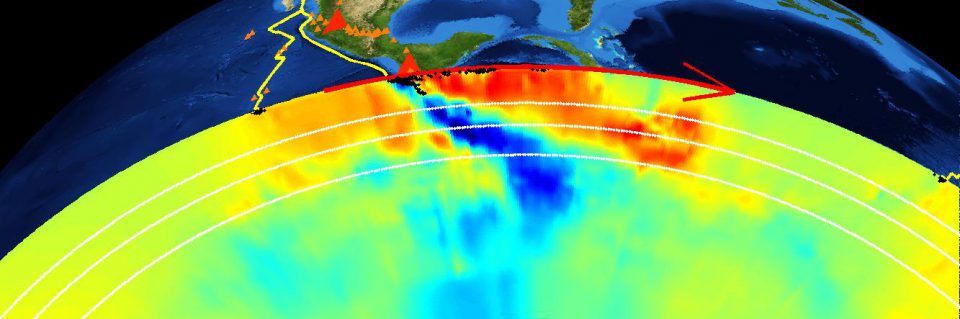
- In places without data (like beneath the ocean) the algorithm traces out the uniform prior that we assume at the beginning.
- This should make it clear that the mean and standard deviation don’t always tell the whole story!
