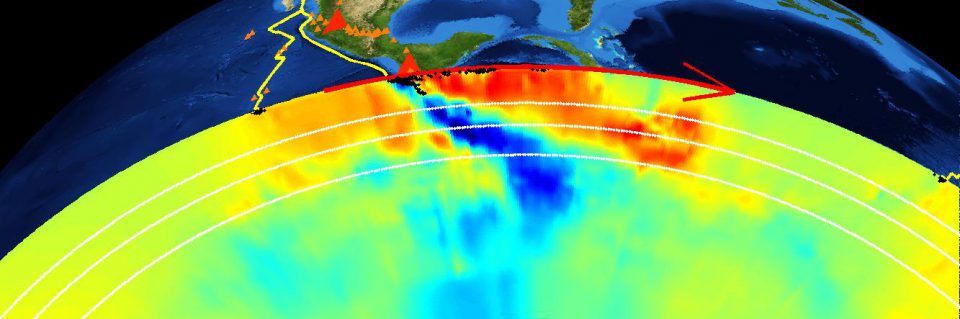
Seismic traveltime tomography gives us images of the subducted slabs of oceanic lithosphere beneath the Ring of Fire. The slices are from the P-wave model MITP_USA_2016MAY. The color scale gives the difference from a 1D model of seismic velocity, from red (1% slower than average) to blue (1% faster than average). Subducted slabs show up as fast features dipping downward from convergent margins. I think looking at it this way helps show the relationship between subduction and seismicity (black dots) and volcanism (orange triangles).
I’m cooking up a nicer version of this for the Earthscope Visualization Challenge (http://www.earthscope.org/public/visualization_challenge). There’s an iPad at stake!
